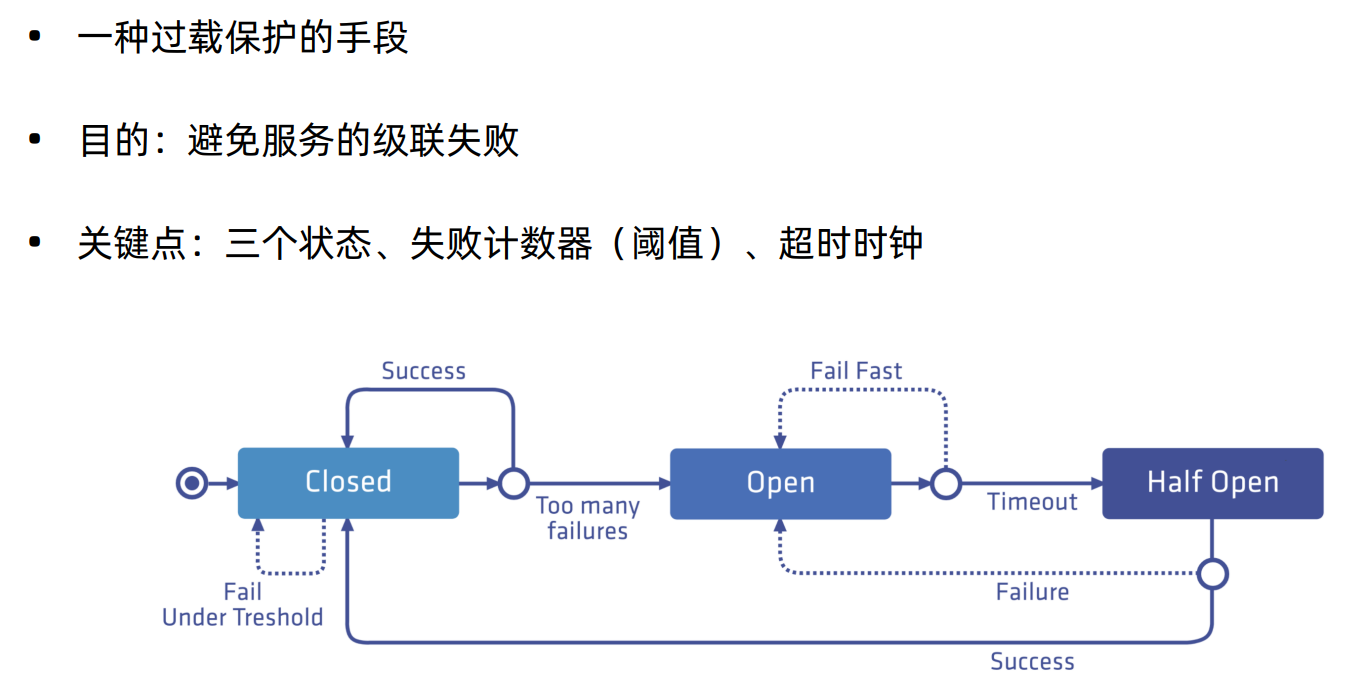
熔断,是创建弹性微服务应用程序的重要模式。熔断能够使您的应用程序具备应对来自故障、潜在峰值和其他未知网络因素影响的能力。
下面我们给httpbin来配置一个熔断,首先配置一个httpbin服务
1 # kubectl apply -f samples/httpbin/ httpbin.yaml
接下来我们给httpbin配置一个熔断
1
2
3
4
5
6
7
8
9
10
11
12
13
14
15
16
17
18
19
20
$ kubectl apply -f - <<EOF apiVersion : networking.istio.io/v1alpha3 kind : DestinationRule metadata : name : httpbin spec : host : httpbin trafficPolicy : connectionPool : tcp : maxConnections : 1 http : http1MaxPendingRequests : 1 maxRequestsPerConnection : 1 outlierDetection : consecutiveErrors : 1 interval : 1s baseEjectionTime : 3m maxEjectionPercent : 100
创建客户端程序以发送流量到 httpbin 服务。这是一个名为 Fortio 的负载测试客户的,其可以控制连接数、并发数及发送 HTTP 请求的延迟。通过 Fortio 能够有效的触发前面 在 DestinationRule 中设置的熔断策略
1 2 3 4 5 6 [root@VM-0 -13 -centos istio-1 .5.1]# kubectl apply -f samples/httpbin/sample-client/fortio-deploy.yaml-0 -13 -centos istio-1 .5.1]# kubectl get pod | grep fortio-6 dc9b4d7d9-9 x5z7 2/2 Running 0 43s
下面我们测试下通过fortio来给httpbin发送请求
1 2 3 4 5 6 7 8 9 10 11 12 13 14 15 16 17 18 19 20 21 22 23 24 25 26 [root@VM-0 -13 -centos istio-1.5 .1 ]# kubectl exec -it fortio-deploy-6 dc9b4d7d9-9 x5z7 -c fortio /usr/bin/fortio 1.1 200 OKserver : envoydate : Fri, 04 Dec 2020 12 :17 :57 GMTtype : application/json 587 access -control-allow-origin: *access -control-allow-credentials: true time : 37
在 DestinationRule 配置中,您定义了 maxConnections: 1 和 http1MaxPendingRequests: 1。 这些规则意味着,如果并发的连接和请求数超过一个,在 istio-proxy 进行进一步的请求和连接时,后续请求或 连接将被阻止。
下面我们来测试下发送并发数为 2 的连接(-c 2),请求 20 次(-n 20)
1
2
3
4
5
6
7
8
9
10
11
12
13
14
15
16
17
18
19
20
21
22
23
24
25
26
27
28
29
30
31
32
33
34
35
[root@VM-0-13-centos istio-1.5.1] 3 Warning (was 2 Info) 0 queries per second, 4->4 procs, for 20 calls: http://httpbin:8000/get 2 thread(s) [gomax 4] for exactly 20 calls (10 per thread + 0) 503 (HTTP/1.1 503) 503 (HTTP/1.1 503) 503 (HTTP/1.1 503) 503 (HTTP/1.1 503) 503 (HTTP/1.1 503) 503 (HTTP/1.1 503) 503 (HTTP/1.1 503) 503 (HTTP/1.1 503) 503 (HTTP/1.1 503) 20 calls. qps=386.6 20 avg 0.0050693187 +/- 0.009171 min 0.000166044 max 0.034073146 sum 0.101386374 11 (for perfect keepalive, would be 2) 200 : 11 (55.0 %) 503 : 9 (45.0 %) 20 avg 126.55 +/- 114.5 min 0 max 231 sum 2531 20 avg 557.85 +/- 286.6 min 241 max 818 sum 11157 20 calls (plus 0 warmup) 5.069 ms avg, 386.6 qps
Code 200 : 11 (55.0 %)
我们接着测试下3个并发执行30次
1
2
3
4
5
6
7
8
9
10
11
12
13
14
15
16
17
18
19
20
21
22
23
24
25
26
27
28
29
30
31
32
33
34
35
36
37
38
39
40
41
[root@VM-0-13-centos istio-1.5.1] 3 Warning (was 2 Info) 0 queries per second, 4->4 procs, for 30 calls: http://httpbin:8000/get 3 thread(s) [gomax 4] for exactly 30 calls (10 per thread + 0) 503 (HTTP/1.1 503) 503 (HTTP/1.1 503) 503 (HTTP/1.1 503) 503 (HTTP/1.1 503) 503 (HTTP/1.1 503) 503 (HTTP/1.1 503) 503 (HTTP/1.1 503) 503 (HTTP/1.1 503) 503 (HTTP/1.1 503) 503 (HTTP/1.1 503) 503 (HTTP/1.1 503) 503 (HTTP/1.1 503) 503 (HTTP/1.1 503) 503 (HTTP/1.1 503) 503 (HTTP/1.1 503) 503 (HTTP/1.1 503) 30 calls. qps=524.79 30 avg 0.0035633327 +/- 0.007463 min 0.000232569 max 0.031839734 sum 0.106899982 17 (for perfect keepalive, would be 3) 200 : 14 (46.7 %) 503 : 16 (53.3 %) 30 avg 107.4 +/- 114.8 min 0 max 231 sum 3222 30 avg 509.86667 +/- 287.4 min 241 max 818 sum 15296 30 calls (plus 0 warmup) 3.563 ms avg, 524.8 qps
Code 200 : 14 (46.7 %)
1 2 3 4 5 6 7 8 9 10 11 12 13 14 15 16 17 18 19 20 21 22 23 24 25 26 27 28 29 30 31 [root@VM-0 -13 -centos istio-1.5 .1 ]# kubectl exec fortio-deploy-6 dc9b4d7d9-9 x5z7 -c istio-proxy -- pilot-agent request GET stats | grep httpbin | grep pending15443 |httpbin |istio -egressgateway.istio-system.svc.cluster.local.circuit_breakers.default.rq_pending_open: 0 15443 |httpbin |istio -egressgateway.istio-system.svc.cluster.local.circuit_breakers.high.rq_pending_open: 0 15443 |httpbin |istio -egressgateway.istio-system.svc.cluster.local.upstream_rq_pending_active: 0 15443 |httpbin |istio -egressgateway.istio-system.svc.cluster.local.upstream_rq_pending_failure_eject: 0 15443 |httpbin |istio -egressgateway.istio-system.svc.cluster.local.upstream_rq_pending_overflow: 0 15443 |httpbin |istio -egressgateway.istio-system.svc.cluster.local.upstream_rq_pending_total: 0 443 |httpbin |istio -egressgateway.istio-system.svc.cluster.local.circuit_breakers.default.rq_pending_open: 0 443 |httpbin |istio -egressgateway.istio-system.svc.cluster.local.circuit_breakers.high.rq_pending_open: 0 443 |httpbin |istio -egressgateway.istio-system.svc.cluster.local.upstream_rq_pending_active: 0 443 |httpbin |istio -egressgateway.istio-system.svc.cluster.local.upstream_rq_pending_failure_eject: 0 443 |httpbin |istio -egressgateway.istio-system.svc.cluster.local.upstream_rq_pending_overflow: 0 443 |httpbin |istio -egressgateway.istio-system.svc.cluster.local.upstream_rq_pending_total: 0 8000 ||httpbin .default.svc.cluster.local.circuit_breakers.default.rq_pending_open: 0 8000 ||httpbin .default.svc.cluster.local.circuit_breakers.high.rq_pending_open: 0 8000 ||httpbin .default.svc.cluster.local.upstream_rq_pending_active: 0 8000 ||httpbin .default.svc.cluster.local.upstream_rq_pending_failure_eject: 0 8000 ||httpbin .default.svc.cluster.local.upstream_rq_pending_overflow: 25 8000 ||httpbin .default.svc.cluster.local.upstream_rq_pending_total: 26 80 |httpbin |istio -egressgateway.istio-system.svc.cluster.local.circuit_breakers.default.rq_pending_open: 0 80 |httpbin |istio -egressgateway.istio-system.svc.cluster.local.circuit_breakers.high.rq_pending_open: 0 80 |httpbin |istio -egressgateway.istio-system.svc.cluster.local.upstream_rq_pending_active: 0 80 |httpbin |istio -egressgateway.istio-system.svc.cluster.local.upstream_rq_pending_failure_eject: 0 80 |httpbin |istio -egressgateway.istio-system.svc.cluster.local.upstream_rq_pending_overflow: 0 80 |httpbin |istio -egressgateway.istio-system.svc.cluster.local.upstream_rq_pending_total: 0 80 ||httpbin .org.circuit_breakers.default.rq_pending_open: 0 80 ||httpbin .org.circuit_breakers.high.rq_pending_open: 0 80 ||httpbin .org.upstream_rq_pending_active: 0 80 ||httpbin .org.upstream_rq_pending_failure_eject: 0 80 ||httpbin .org.upstream_rq_pending_overflow: 0 80 ||httpbin .org.upstream_rq_pending_total: 0
cluster.outbound|8000||httpbin.default.svc.cluster.local.upstream_rq_pending_overflow: 25 这意味着,目前为止已有25个调用被标记为熔断