istio入门系列之prometheus和grafana
通过demo方式部署istio,会默认部署promethes和grafana来作为指标的监控和展示,我们可以把promethes和grafana对应的service通过nodeport的方式来进行访问。
prometheus
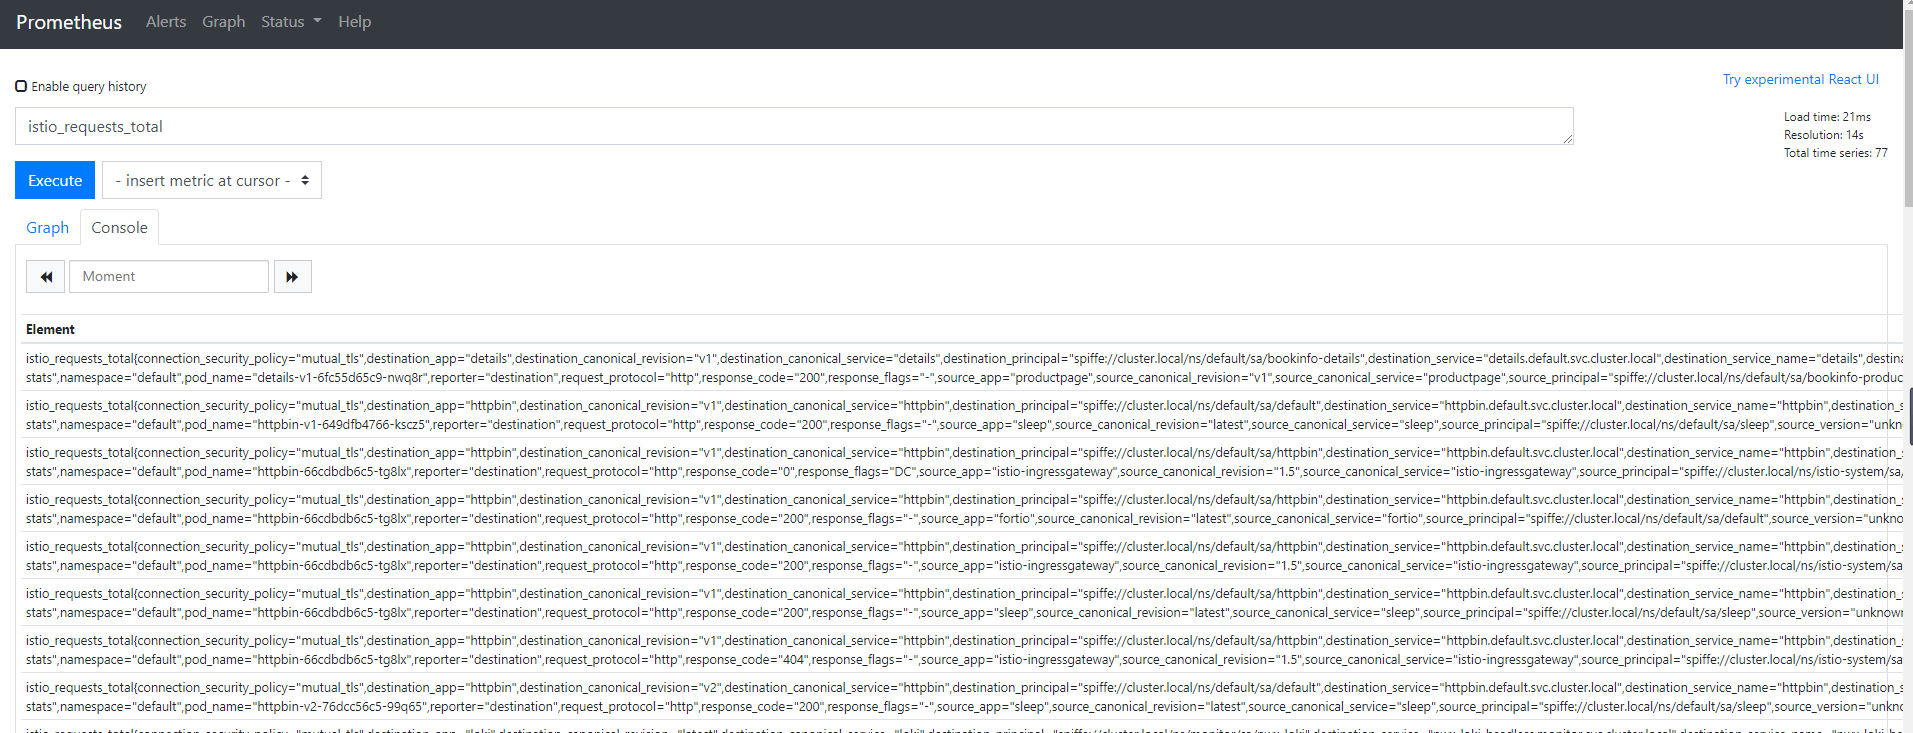
浏览器上输入 http://node_ip:nodeport/graph,在查询框中输入istio_requests_total查看指标
其他查询:
- 请求 productpage 服务的总次数:
1 | |
- 请求 reviews 服务 V3 版本的总次数:
1 | |
该查询返回所有请求 reviews 服务 v3 版本的当前总次数。
- 过去 5 分钟 productpage 服务所有实例的请求频次:
1 | |
这里我们有一些常用的istio指标
- 请求数(istio_requests_total)
- 请求时长(istio_request_duration_milliseconds)
- 请求大小(istio_request_bytes)
- 响应大小(istio_response_bytes)
- TCP 发送字节数(istio_tcp_sent_bytes_total)
- TCP 接受字节数(istio_tcp_received_bytes_total)
- TCP 连接打开数(istio_tcp_connections_opened_total)
- TCP 连接关闭数(istio_tcp_connections_closed_total)
Grafana
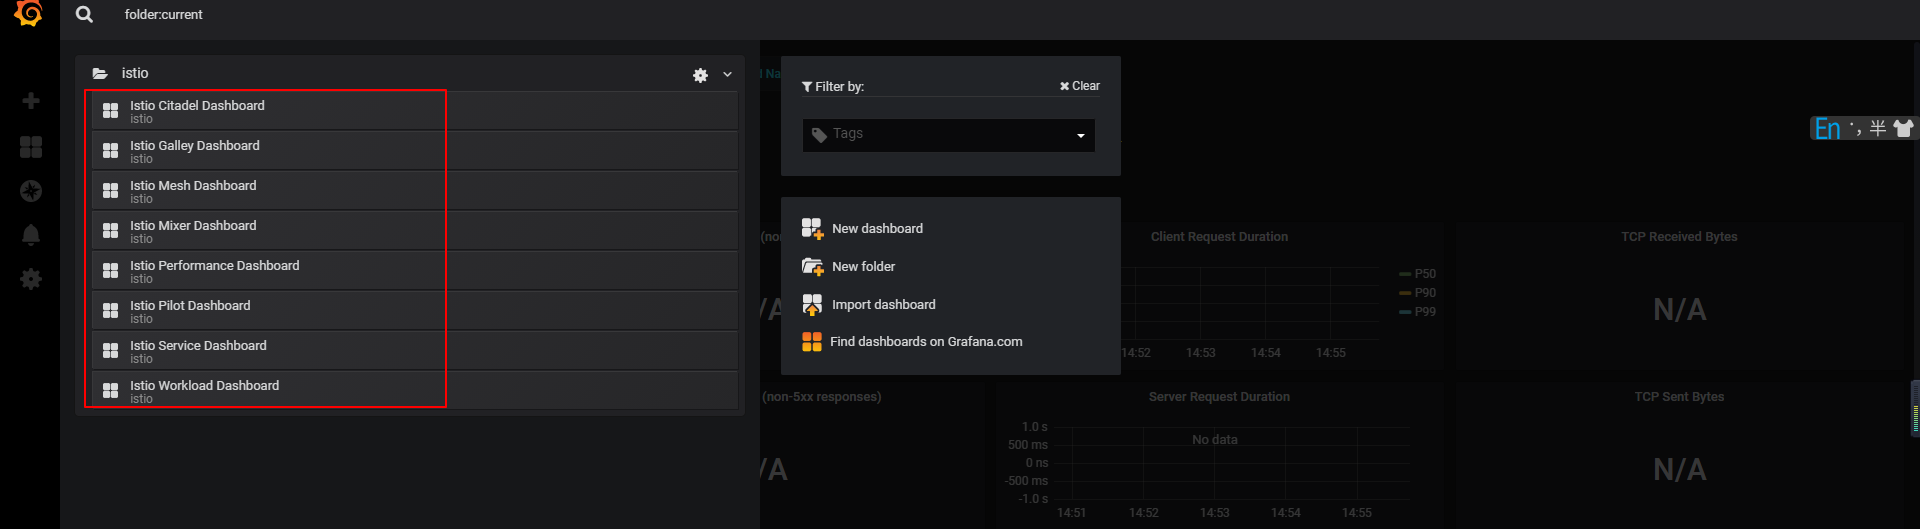
浏览器上输入 http://node_ip:nodeport,查看grafana展示界面,这里对应的nodeport是grafana的service所对应的。
grafana默认提供了以下几个dashboard
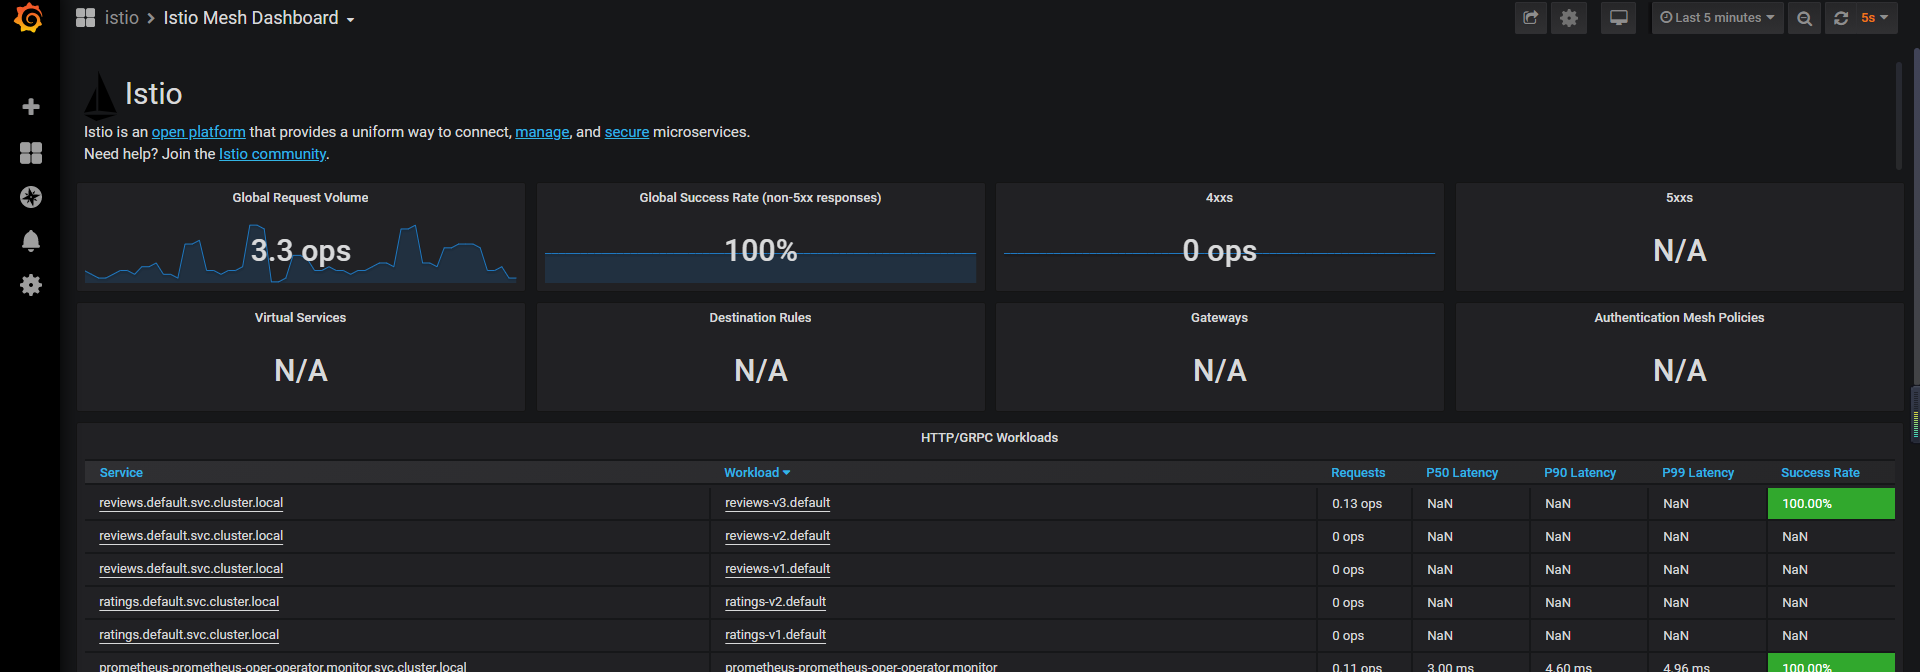
我们访问bookinfo的界面,可以在mesh的dashboard查看到流量的变化情况
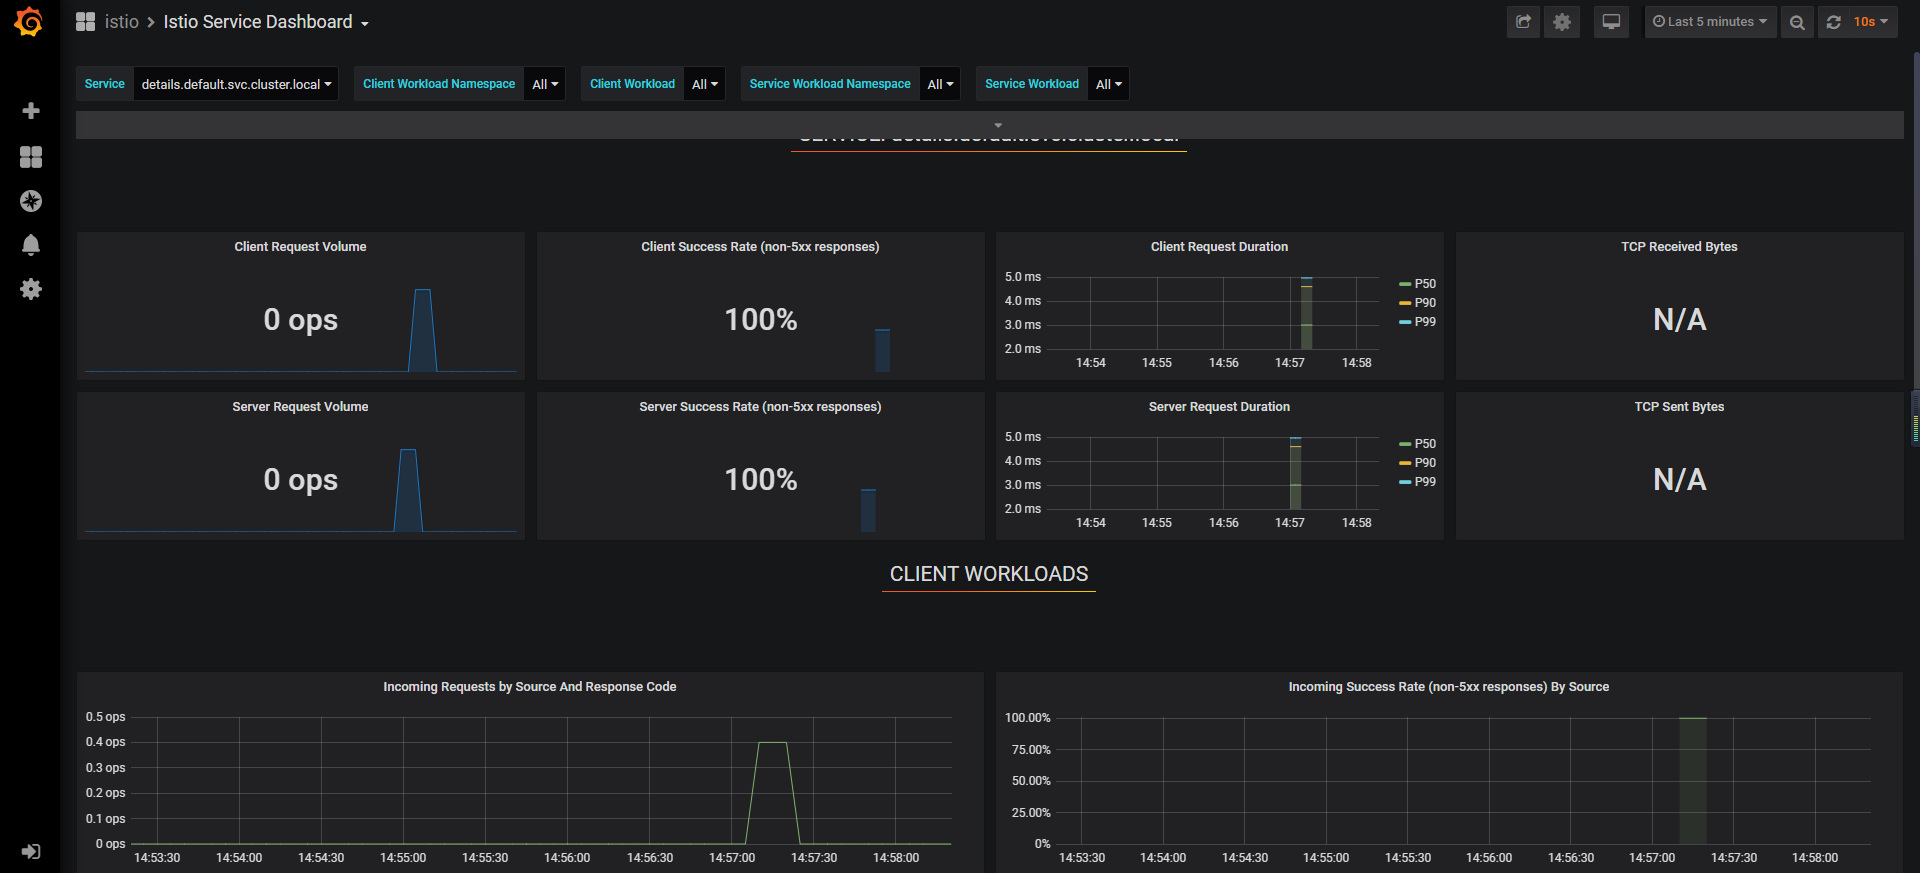
service dashboard给出了服务,以及更进一步的服务的客户端工作负载(调用该服务的工作负载)和服务工作负载(提供该服务的工作负载)的详细指标
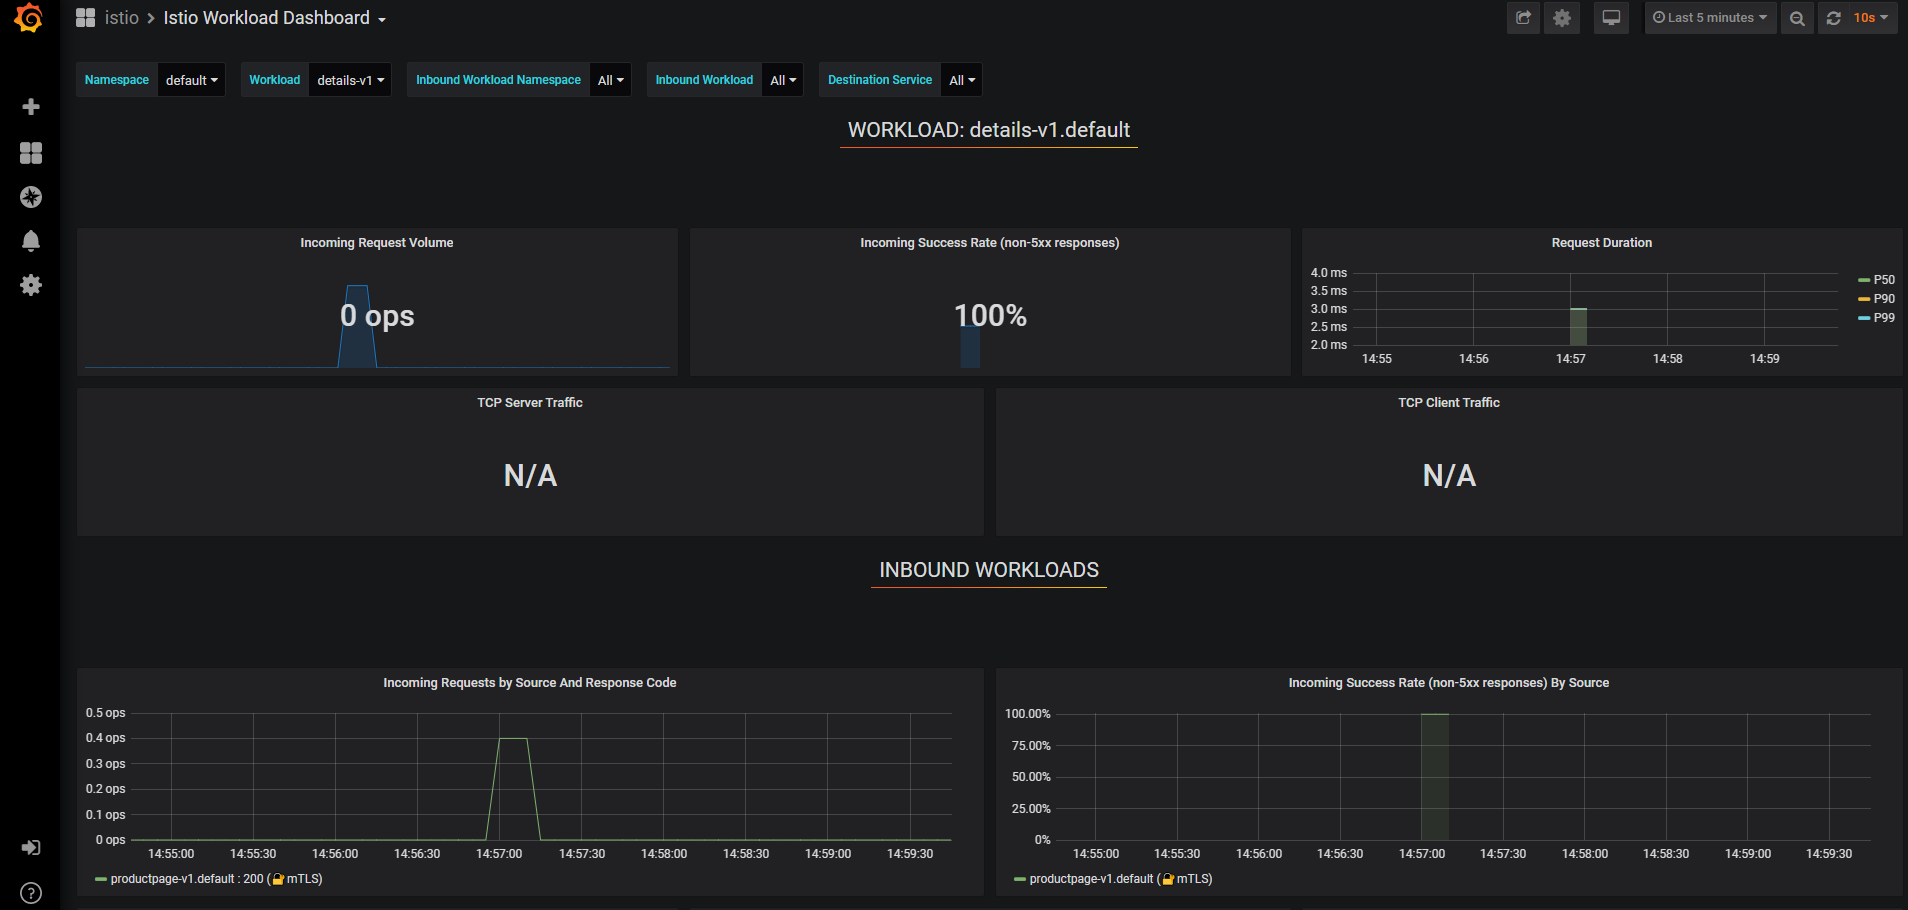
workload dashboard给出了每一个工作负载,以及更进一步的该工作负载的入站工作负载(将请求发送到该工作负载的工作负载)和出站服务(此工作负载向其发送请求的服务)的详细指标。
istio入门系列之prometheus和grafana
https://www.niewx.cn/2020/12/04/2020-12-04-prometheus-and-grafana-of-istio-entry-series/