istio入门系列之获取Envoy访问日志

Istio 最简单的日志类型是 Envoy 的访问日志。Envoy 代理打印访问信息到标准输出。Envoy 容器的标准输出能够通过 kubectl logs 命令打印出来。

下面我们来学习一下如何查看Envoy的日志来进行分析问题。首先我们部署一个sleep和httpbin的服务,通过sleep来调用httpbin,通过查看httpbin的envoy的日志分析业务请求。

首先我们查看下Envoy的日志访问是否开启,我们查看下istio这个configmap中的配置

1
2
3
4
5
6
7
8
[root@VM-0-13-centos istio-1.5.1]# kubectl describe cm istio -n istio-system | grep accessLogFile
{"apiVersion":"v1","data":{"mesh":"# Set enableTracing to false to disable request tracing.\nenableTracing: true\n\n# Set accessLogFile to...
# Set accessLogFile to empty string to disable access log.
accessLogFile: "/dev/stdout"
[root@VM-0-13-centos istio-1.5.1]# kubectl describe cm istio -n istio-system | grep accessLogEncoding
accessLogEncoding: 'JSON'
[root@VM-0-13-centos istio-1.5.1]# kubectl describe cm istio -n istio-system | grep accessLogFormat
accessLogFormat: ""
参数配置项 说明
global.proxy.accessLogFile 日志输出文件,空为关闭输出
global.proxy.accessLogEncoding 日志编码格式:JSON、TEXT
global.proxy.accessLogFormat 配置显示在日志中的字段,空为默认格式
global.proxy.logLevel 日志级别,空为 warning,可选trace、debug、info、warning、error、critical、off

如果你的日志中下面的配置项没有开启,然后配置一下istio这个cm,重新加载一下istiod这个pod既可。这里我们已经开启了日志输出,用的是JSON格式。

下面我们来对httpbin来进行访问

1
2
3
4
5
6
7
8
9
10
11
12
13
14
15
16
17
18
19
20
21
22
23
24
25
26
27
28
29
[root@VM-0-13-centos istio-1.5.1]# kubectl exec -it $(kubectl get pod -l app=sleep -o jsonpath='{.items[0].metadata.name}') -c sleep -- curl -v httpbin:8000/status/418
* Trying 172.16.22.210:8000...
* Connected to httpbin (172.16.22.210) port 8000 (#0)
> GET /status/418 HTTP/1.1
> Host: httpbin:8000
> User-Agent: curl/7.69.1
> Accept: */*
>
* Mark bundle as not supporting multiuse
< HTTP/1.1 418 Unknown
< server: envoy
< date: Tue, 08 Dec 2020 03:13:10 GMT
< x-more-info: http://tools.ietf.org/html/rfc2324
< access-control-allow-origin: *
< access-control-allow-credentials: true
< content-length: 135
< x-envoy-upstream-service-time: 16
<

-=[ teapot ]=-

_...._
.' _ _ `.
| ."` ^ `". _,
\_;`"---"`|//
| ;/
\_ _/
`"""`
* Connection #0 to host httpbin left intact

我们分别查看下sleep和httpbin的日志

1
2
3
4
[root@VM-0-13-centos ~]# kubectl logs -l app=sleep -c istio-proxy
{"bytes_sent":"135","upstream_cluster":"outbound|8000||httpbin.default.svc.cluster.local","downstream_remote_address":"10.0.1.38:35842","authority":"httpbin:8000","path":"/status/418","protocol":"HTTP/1.1","upstream_service_time":"1","upstream_local_address":"10.0.1.38:41142","duration":"2","upstream_transport_failure_reason":"-","route_name":"default","downstream_local_address":"172.16.22.210:8000","user_agent":"curl/7.69.1","response_code":"418","response_flags":"-","start_time":"2020-12-08T03:24:22.162Z","method":"GET","request_id":"b6d7d73c-3f47-919f-9836-e8cd5d8df2da","upstream_host":"10.0.1.41:80","x_forwarded_for":"-","requested_server_name":"-","bytes_received":"0","istio_policy_status":"-"}
[root@VM-0-13-centos ~]# kubectl logs -l app=httpbin -c istio-proxy
{"istio_policy_status":"-","bytes_sent":"135","upstream_cluster":"inbound|8000|http|httpbin.default.svc.cluster.local","downstream_remote_address":"10.0.1.38:41142","authority":"httpbin:8000","path":"/status/418","protocol":"HTTP/1.1","upstream_service_time":"0","upstream_local_address":"127.0.0.1:48374","duration":"1","upstream_transport_failure_reason":"-","route_name":"default","downstream_local_address":"10.0.1.41:80","user_agent":"curl/7.69.1","response_code":"418","response_flags":"-","start_time":"2020-12-08T03:24:22.162Z","method":"GET","request_id":"b6d7d73c-3f47-919f-9836-e8cd5d8df2da","upstream_host":"127.0.0.1:80","x_forwarded_for":"-","requested_server_name":"outbound_.8000_._.httpbin.default.svc.cluster.local","bytes_received":"0"}

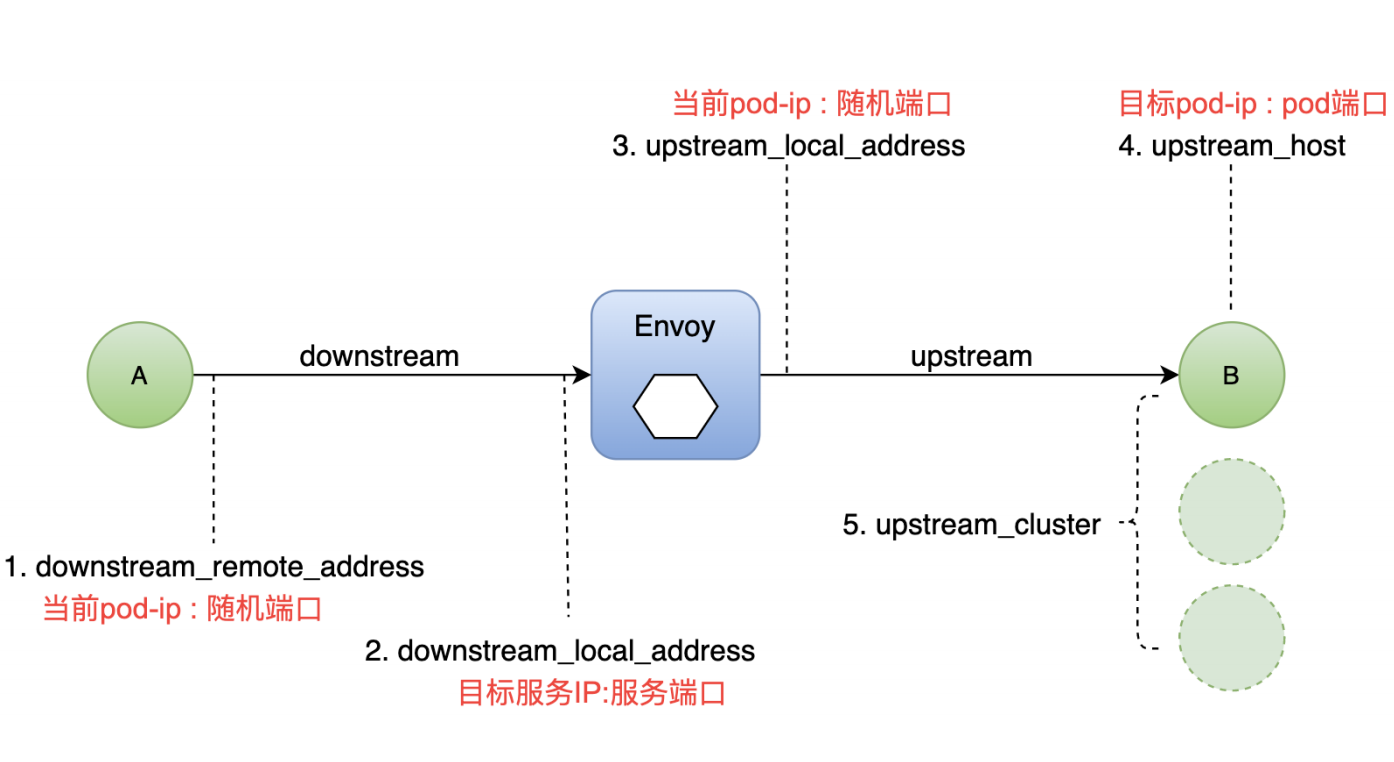
下面我们来分析一下对应的日志,envoy的日志主要分为下面的部分

upload-image

sleep客户端的日志格式化如下

1
2
3
4
5
6
7
8
9
10
11
12
13
14
15
16
17
18
19
20
21
22
23
24
25
{
"bytes_sent": "135",
"upstream_cluster": "outbound|8000||httpbin.default.svc.cluster.local",
"downstream_remote_address": "10.0.1.38:35842", #客户端sleep的podip+随机端口
"authority": "httpbin:8000",
"path": "/status/418",
"protocol": "HTTP/1.1",
"upstream_service_time": "1",
"upstream_local_address": "10.0.1.38:41142", #服务端httpbin的podip+随机端口
"duration": "2",
"upstream_transport_failure_reason": "-",
"route_name": "default",
"downstream_local_address": "172.16.22.210:8000", #服务端httpbin的svcip
"user_agent": "curl/7.69.1",
"response_code": "418",
"response_flags": "-",
"start_time": "2020-12-08T03:24:22.162Z",
"method": "GET",
"request_id": "b6d7d73c-3f47-919f-9836-e8cd5d8df2da",
"upstream_host": "10.0.1.41:80", # 服务端的podip和端口
"x_forwarded_for": "-",
"requested_server_name": "-",
"bytes_received": "0",
"istio_policy_status": "-"
}

httpbin服务端的日志格式化如下

1
2
3
4
5
6
7
8
9
10
11
12
13
14
15
16
17
18
19
20
21
22
23
24
25
{
"istio_policy_status": "-",
"bytes_sent": "135",
"upstream_cluster": "inbound|8000|http|httpbin.default.svc.cluster.local",
"downstream_remote_address": "10.0.1.38:41142",
"authority": "httpbin:8000",
"path": "/status/418",
"protocol": "HTTP/1.1",
"upstream_service_time": "0",
"upstream_local_address": "127.0.0.1:48374",
"duration": "1",
"upstream_transport_failure_reason": "-",
"route_name": "default",
"downstream_local_address": "10.0.1.41:80",
"user_agent": "curl/7.69.1",
"response_code": "418",
"response_flags": "-",
"start_time": "2020-12-08T03:24:22.162Z",
"method": "GET",
"request_id": "b6d7d73c-3f47-919f-9836-e8cd5d8df2da",
"upstream_host": "127.0.0.1:80",
"x_forwarded_for": "-",
"requested_server_name": "outbound_.8000_._.httpbin.default.svc.cluster.local",
"bytes_received": "0"
}

这个有个非常重要的字段是RESPONSE_FLAGS,主要有以下几种含义

  • UH:upstream cluster 中没有健康的 host,503
  • UF:upstream 连接失败,503
  • UO:upstream overflow(熔断)
  • NR:没有路由配置,404
  • URX:请求被拒绝因为限流或最大连接次数

istio入门系列之获取Envoy访问日志
https://www.niewx.cn/2020/12/05/2020-12-05-Get-Envoy-access-log-of-istio-entry-series/
作者
VashonNie
发布于
2020年12月5日
许可协议