istio入门系列之自动化灰度发布

本章我们学习下如何通过Flagger来实现自动灰度发布的流程,Flagger的实现原理和介绍如下图。

upload-image

upload-image

下面我们来部署一下flagger

添加flagger的helm repo仓库

1
2
[root@VM-0-13-centos ~]# helm repo add flagger https://flagger.app
"flagger" has been added to your repositories
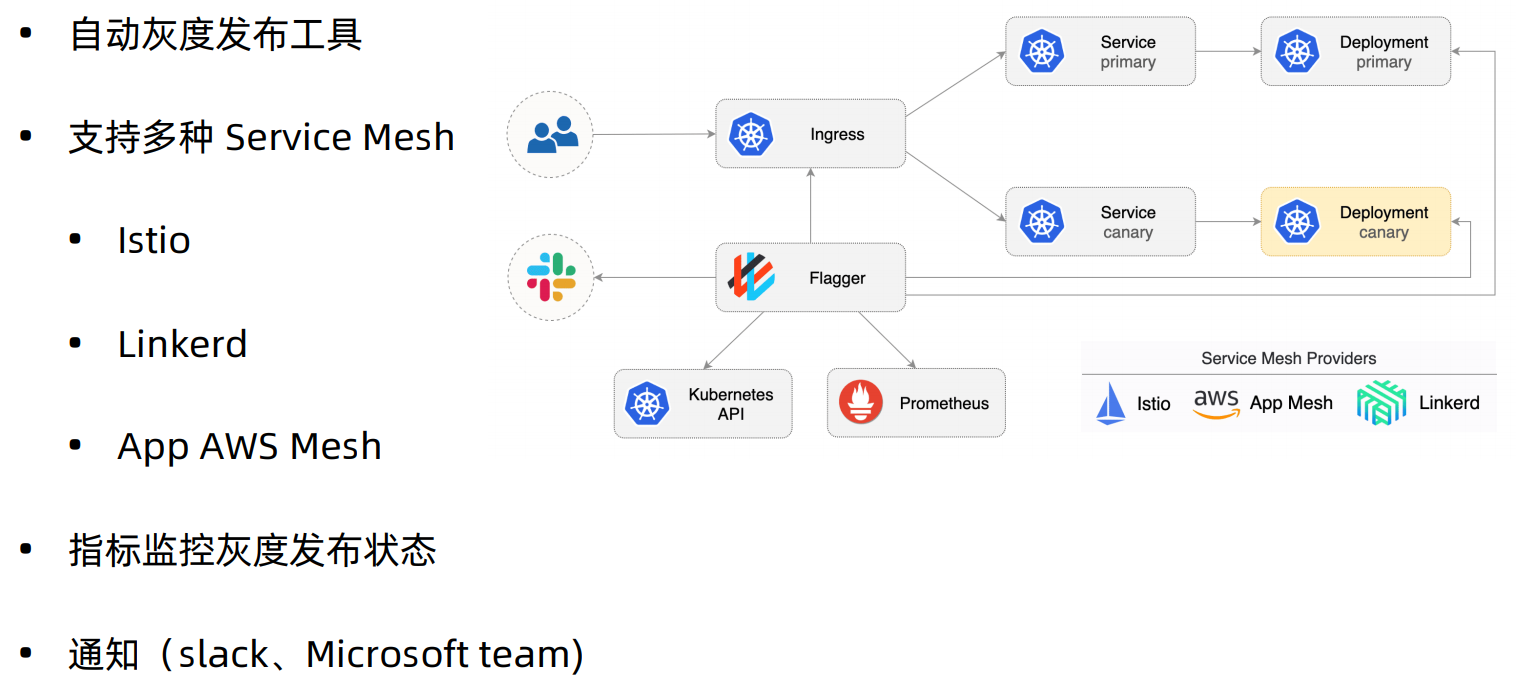
安装flagger的CRD

1
2
3
4
[root@VM-0-13-centos ~]# kubectl apply -f https://raw.githubusercontent.com/weaveworks/flagger/master/artifacts/flagger/crd.yaml
customresourcedefinition.apiextensions.k8s.io/canaries.flagger.app created
customresourcedefinition.apiextensions.k8s.io/metrictemplates.flagger.app created
customresourcedefinition.apiextensions.k8s.io/alertproviders.flagger.app created

部署flagger

这里我们需要指定下prometheus的地址,和mesh提供商

1
2
3
4
5
helm upgrade -i flagger flagger/flagger \
--namespace=istio-system \
--set crd.create=false \
--set meshProvider=istio \
--set metricsServer=http://prometheus-prometheus-oper-prometheus.monitor:9090

通过slack来进行灰度发布消息接受

1
2
3
4
5
6
helm upgrade -i flagger flagger/flagger \
--namespace=istio-system \
--set crd.create=false \
--set slack.url=https://hooks.slack.com/services/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 \
--set slack.channel=flagger \
--set slack.user=flagger

部署grafana查看灰度发布的过程

1
2
3
4
5
helm upgrade -i flagger-grafana flagger/grafana \
--namespace=istio-system \
--set url=http://prometheus-prometheus-oper-prometheus.monitor:9090 \
--set user=admin \
--set password=admin

配置一个ingress网关暴露服务

1
2
3
4
5
6
7
8
9
10
11
12
13
14
15
16
17
kubectl apply -f - <<EOF 
apiVersion: networking.istio.io/v1alpha3
kind: Gateway
metadata:
name: public-gateway
namespace: istio-system
spec:
selector:
istio: ingressgateway
servers:
- port:
number: 80
name: http
protocol: HTTP
hosts:
- "*"
EOF

部署demo服务

demo应用部署参考https://www.niewx.cn/istio/2020/12/08/istio%E5%85%A5%E9%97%A8%E7%B3%BB%E5%88%97%E4%B9%8B%E5%AE%9E%E6%88%98%E5%85%A5%E9%97%A8%E5%87%86%E5%A4%87/

部署负载测试工具

1
2
3
4
kubectl apply -k https://github.com/weaveworks/flagger/tree/master/kustomize/tester
[root@VM-0-13-centos ~]# kubectl get pod
NAME READY STATUS RESTARTS AGE
flagger-loadtester-77b756b8d6-vhwxn 1/1 Running 0 98s

httpbin配置hpa

1
2
3
4
5
6
7
8
9
10
11
12
13
14
15
16
17
18
19
20
k apply -n demo -f - <<EOF
apiVersion: autoscaling/v2beta1
kind: HorizontalPodAutoscaler
metadata:
name: httpbin
spec:
scaleTargetRef:
apiVersion: apps/v1
kind: Deployment
name: httpbin
minReplicas: 2
maxReplicas: 4
metrics:
- type: Resource
resource:
name: cpu
# scale up if usage is above
# 99% of the requested CPU (100m)
targetAverageUtilization: 99
EOF

配置flagger的Canary

1
2
3
4
5
6
7
8
9
10
11
12
13
14
15
16
17
18
19
20
21
22
23
24
25
26
27
28
29
30
31
32
33
34
35
36
37
38
39
40
41
42
43
44
45
46
47
48
49
50
51
52
53
54
55
56
57
58
59
60
61
62
63
kubectl apply -f -<<EOF
apiVersion: flagger.app/v1beta1
kind: Canary
metadata:
name: httpbin
namespace: demo
spec:
# deployment reference
targetRef:
apiVersion: apps/v1
kind: Deployment
name: httpbin
# the maximum time in seconds for the canary deployment
# to make progress before it is rollback (default 600s)
progressDeadlineSeconds: 60
# HPA reference (optional)
autoscalerRef:
apiVersion: autoscaling/v2beta1
kind: HorizontalPodAutoscaler
name: httpbin
service:
# service port number
port: 8000
# container port number or name (optional)
targetPort: 80
# Istio gateways (optional)
gateways:
- public-gateway.istio-system.svc.cluster.local
analysis:
# schedule interval (default 60s)
interval: 30s
# max number of failed metric checks before rollback
threshold: 5
# max traffic percentage routed to canary
# percentage (0-100)
maxWeight: 100
# canary increment step
# percentage (0-100)
stepWeight: 20
metrics:
- name: request-success-rate
# minimum req success rate (non 5xx responses)
# percentage (0-100)
thresholdRange:
min: 99
interval: 1m
- name: latency
templateRef:
name: latency
namespace: istio-system
# maximum req duration P99
# milliseconds
thresholdRange:
max: 500
interval: 30s
# testing (optional)
webhooks:
- name: load-test
url: http://flagger-loadtester/
timeout: 5s
metadata:
cmd: "hey -z 1m -q 10 -c 2 http://httpbin-canary.demo:8000/headers"
EOF

我们查看下canary的状态

1
2
3
4
5
6
7
8
9
10
11
12
13
14
15
16
17
18
19
20
21
22
23
24
25
26
27
28
29
30
31
32
33
34
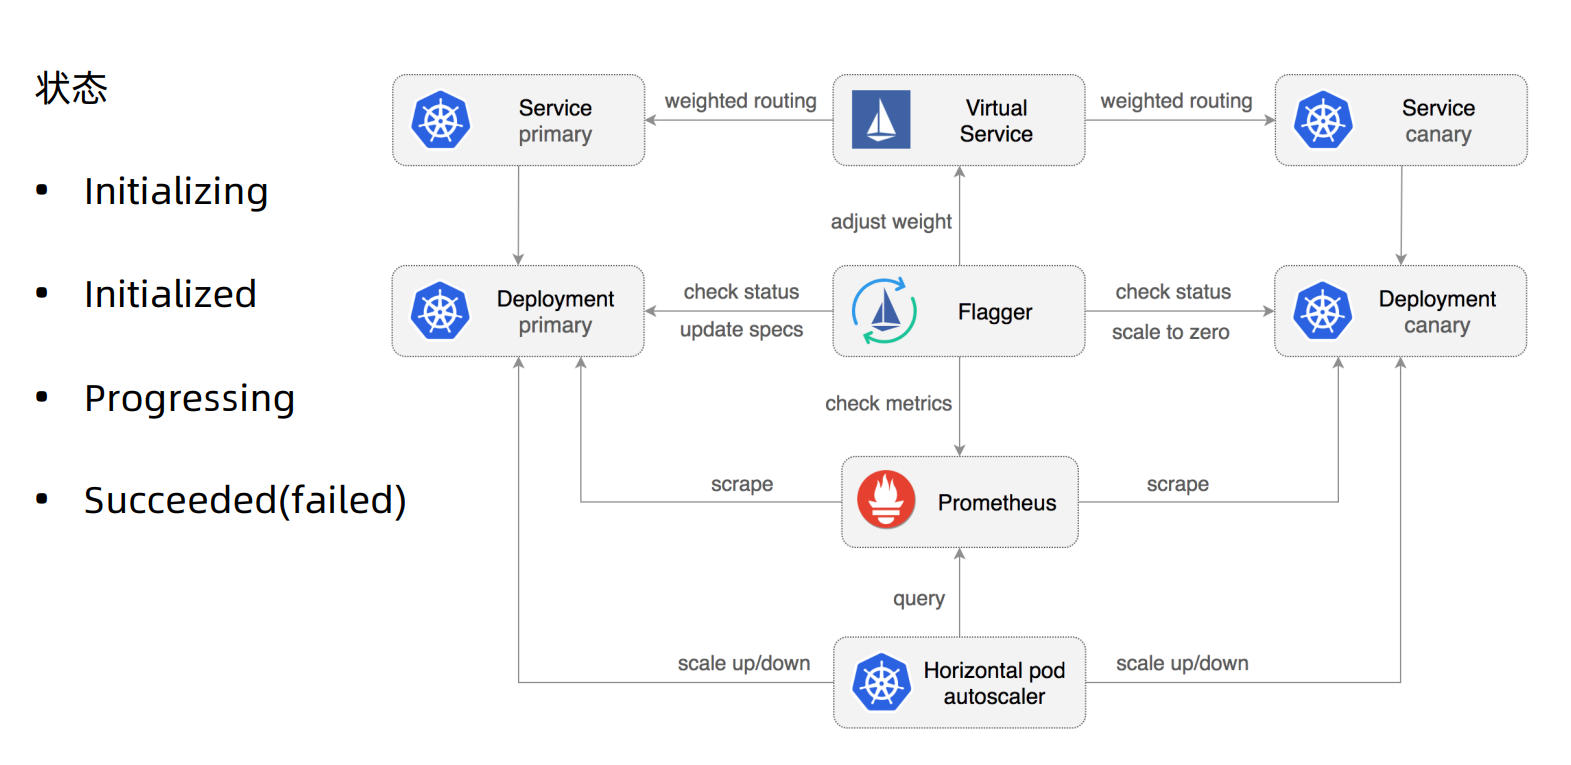
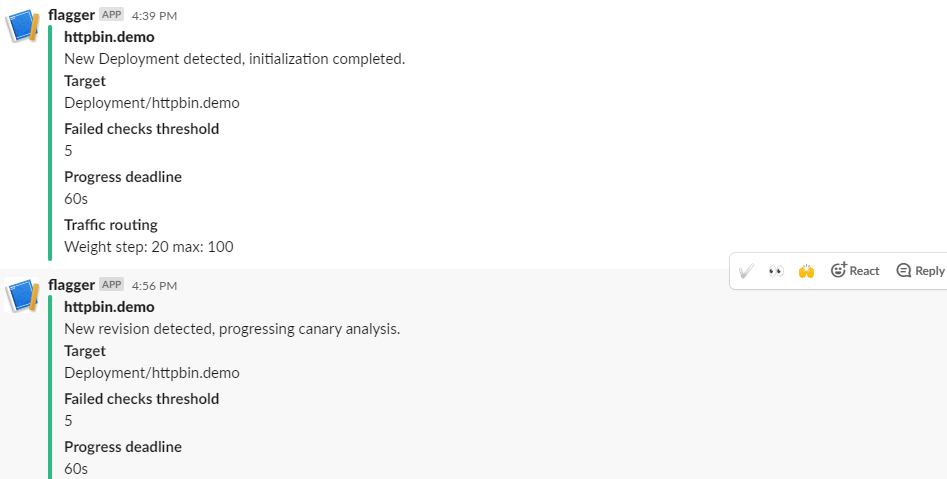
[root@VM-0-13-centos ~]# k get canary -n demo
NAME STATUS WEIGHT LASTTRANSITIONTIME
httpbin Initialized 0 2020-12-21T08:39:13Z

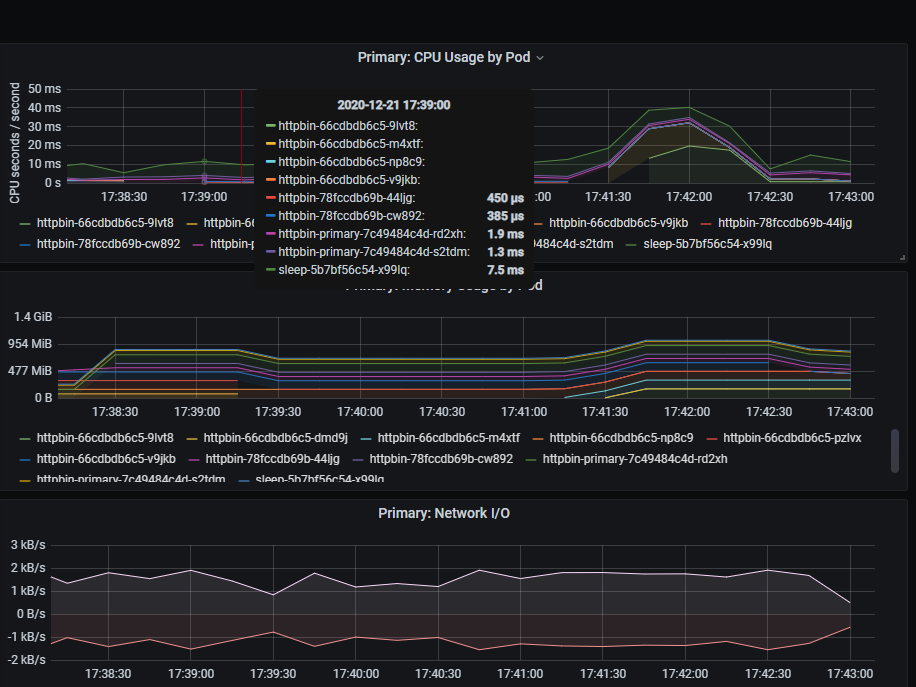
[root@VM-0-13-centos ~]# kubectl get all -n demo
NAME READY STATUS RESTARTS AGE
pod/httpbin-66cdbdb6c5-mqlqt 1/1 Running 0 52s
pod/httpbin-66cdbdb6c5-wgjxs 1/1 Running 0 11m
pod/httpbin-primary-7c49484c4d-rd2xh 1/1 Running 0 12m
pod/httpbin-primary-7c49484c4d-s2tdm 1/1 Running 0 12m
pod/sleep-5b7bf56c54-x99lq 1/1 Running 0 165m

NAME TYPE CLUSTER-IP EXTERNAL-IP PORT(S) AGE
service/httpbin ClusterIP 172.16.8.254 <none> 8000/TCP 8d
service/httpbin-canary ClusterIP 172.16.24.30 <none> 8000/TCP 12m
service/httpbin-primary ClusterIP 172.16.96.245 <none> 8000/TCP 12m
service/sleep ClusterIP 172.16.77.228 <none> 80/TCP 8d

NAME READY UP-TO-DATE AVAILABLE AGE
deployment.apps/httpbin 2/2 2 2 8d
deployment.apps/httpbin-primary 2/2 2 2 12m
deployment.apps/sleep 1/1 1 1 8d

NAME DESIRED CURRENT READY AGE
replicaset.apps/httpbin-66cdbdb6c5 2 2 2 8d
replicaset.apps/httpbin-primary-7c49484c4d 2 2 2 12m
replicaset.apps/sleep-5b7bf56c54 1 1 1 8d

NAME REFERENCE TARGETS MINPODS MAXPODS REPLICAS AGE
horizontalpodautoscaler.autoscaling/httpbin Deployment/httpbin <unknown>/99% 2 4 2 14m
horizontalpodautoscaler.autoscaling/httpbin-primary Deployment/httpbin-primary <unknown>/99% 2 4 2 12m

NAME STATUS WEIGHT LASTTRANSITIONTIME
canary.flagger.app/httpbin Initialized 0 2020-12-21T08:39:13Z

从上面可以看出,canary初始化为我们创建了2个service,httpbin-canary和httpbin-primary,同时也创建了httpbin-primary这个负载,同时还给我们创建一个

1
2
3
4
5
6
7
8
9
10
11
12
13
14
15
16
17
18
19
20
21
22
23
24
25
26
27
28
29
30
31
32
33
34
35
36
37
38
39
40
41
42
43
44
45
46
47
48
49
50
51
52
53
54
55
56
57
58
59
60
[root@VM-0-3-centos ~]# kubectl get vs -n demo -o yaml
apiVersion: v1
items:
- apiVersion: networking.istio.io/v1beta1
kind: VirtualService
metadata:
creationTimestamp: "2020-12-21T08:39:13Z"
generation: 1
managedFields:
- apiVersion: networking.istio.io/v1alpha3
fieldsType: FieldsV1
fieldsV1:
f:metadata:
f:ownerReferences:
.: {}
k:{"uid":"fd474481-0191-4f68-a606-13d88d5040e8"}:
.: {}
f:apiVersion: {}
f:blockOwnerDeletion: {}
f:controller: {}
f:kind: {}
f:name: {}
f:uid: {}
f:spec:
.: {}
f:gateways: {}
f:hosts: {}
f:http: {}
manager: flagger
operation: Update
time: "2020-12-21T08:39:13Z"
name: httpbin
namespace: demo
ownerReferences:
- apiVersion: flagger.app/v1beta1
blockOwnerDeletion: true
controller: true
kind: Canary
name: httpbin
uid: fd474481-0191-4f68-a606-13d88d5040e8
resourceVersion: "3463233849"
selfLink: /apis/networking.istio.io/v1beta1/namespaces/demo/virtualservices/httpbin
uid: 62d89418-2e1c-41b1-b072-25595c519cd4
spec:
gateways:
- public-gateway.istio-system.svc.cluster.local
hosts:
- httpbin
http:
- route:
- destination:
host: httpbin-primary
weight: 100
- destination:
host: httpbin-canary
weight: 0
kind: List
metadata:
resourceVersion: ""
selfLink: ""

发布httpbin服务触发灰度发布

1
2
[root@VM-0-3-centos ~]# kubectl -n demo set image deployment/httpbin httpbin=ccr.ccs.tencentyun.com/v_cjweichen/nwx-reg:v1
deployment.apps/httpbin image updated

不断的去循环访问

1
2
3
4
#循环访问
k exec -it -n demo pod/sleep-6bdb595bcb-bstrp -c sleep sh

while [ 1 ]; do curl http://httpbin.demo:8000/headers;sleep 2s; done

检查canary的流量版本权重变化

1
2
3
k describe vs httpbin -ndemo

k describe canary httpbin -n demo

最终会将所有canary版本提成primary版本,删除旧的版本,vs中也会将httpbin-canary的权重配置为100

通过grafana查看流量的变化

upload-image

slack查看灰度发布的流程信息

upload-image


istio入门系列之自动化灰度发布
https://www.niewx.cn/2020/12/10/2020-12-10-Automated-grayscale-release-of-istio-entry-series/
作者
VashonNie
发布于
2020年12月10日
许可协议